01
Create a strategy and a backtest session
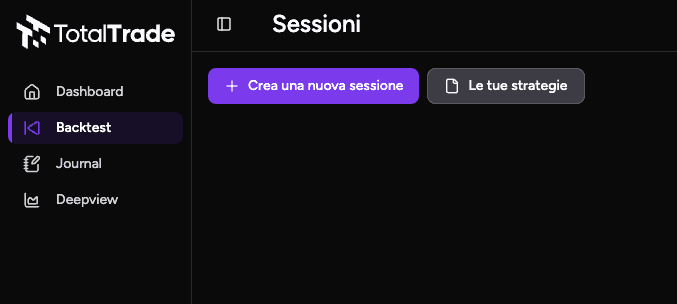
Open Backtest and select Your Strategies. Give the strategy a name, then create the session where you want to test it. Once everything is ready, press Play to start the historical market simulation.
Learn how the TotalTrade Backtester works. Create strategies and sessions, use Bar Replay, place orders, save drawing layouts, check economic events and review performance.
Try it for freeOpen Backtest and select Your Strategies. Give the strategy a name, then create the session where you want to test it. Once everything is ready, press Play to start the historical market simulation.
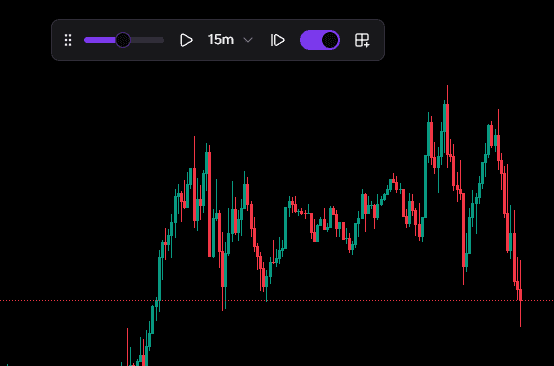
Bar Replay is the control that moves the chart forward one candle at a time or plays it automatically. You can slow the replay down or speed it up. The timeframe switch lets you keep the analysis timeframe in sync with the one used to advance the chart, or choose a different timeframe when the test calls for it.
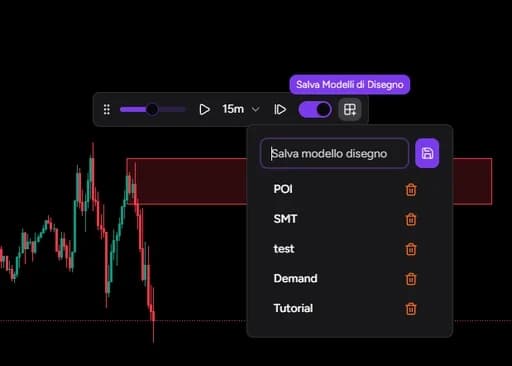
The drawing layout control sits inside Bar Replay. Use it to save the drawings on your chart as a template or apply a layout you created earlier.
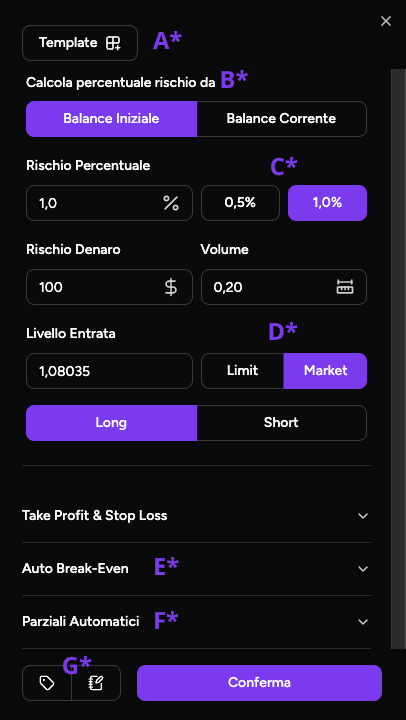
When you find an opportunity, draw the position on the TradingView chart and select Place Order. The panel gives you control over every part of the trade. Section A lets you choose a saved template or create a new one. Templates store risk, automatic partials and automatic break even, so you do not have to rebuild the same management plan every time. In section B you choose whether risk is calculated from the initial or current balance. Section C lets you set risk as a percentage, cash amount or volume. The other values update as you type. Section D controls the entry. You can enter at market or with a limit order and choose whether the position is long or short. The advanced controls sit below. Section E enables automatic break even, while section F handles automatic partials. In section G you can add tags and notes, keeping the idea behind the trade close to the execution.
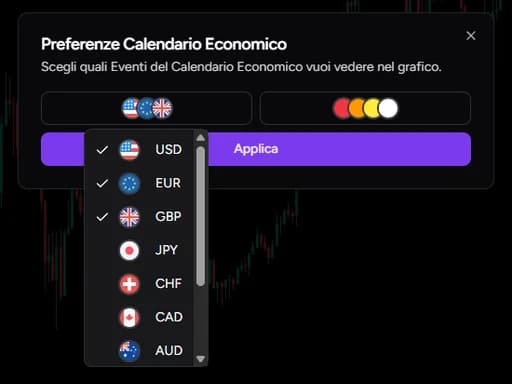
Open the Economic Calendar during the test to see the most important scheduled events for that historical period. You can filter countries and impact levels, which helps you reproduce the market context more accurately. This makes it easier to study how the strategy behaves around relevant news without leaving the Backtester.
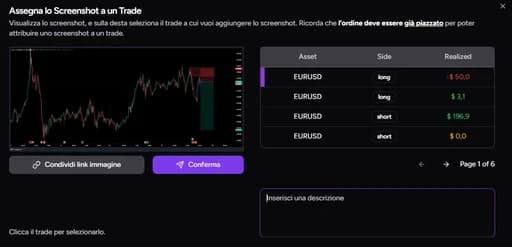
Take one or more screenshots during or after a trade to preserve what the chart looked like. You can also update the comment added when the position was opened. These details make the later review more useful because you can revisit the setup, execution and reasoning instead of relying on memory.
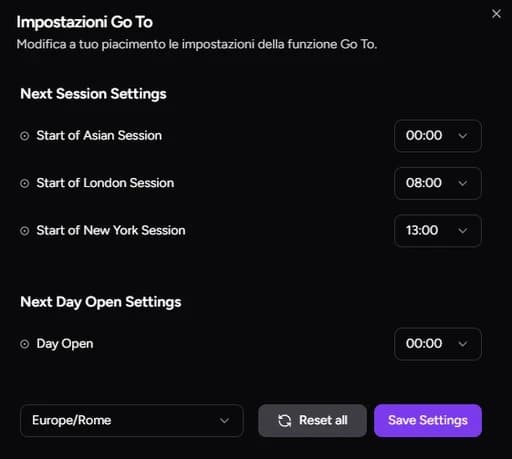
Go To lets you jump to the next day or trading session without advancing every candle. You can customise session opening times to match the hours you trade, such as London or New York. Use it when you want to speed up the test or focus on a specific part of the market day.
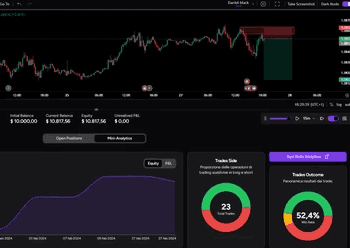
Drag the lower panel upwards to open Mini Analytics while the backtest is running. You can monitor the equity curve, win rate, total number of trades and the history of closed positions without leaving the chart. This keeps testing and analysis in the same window.
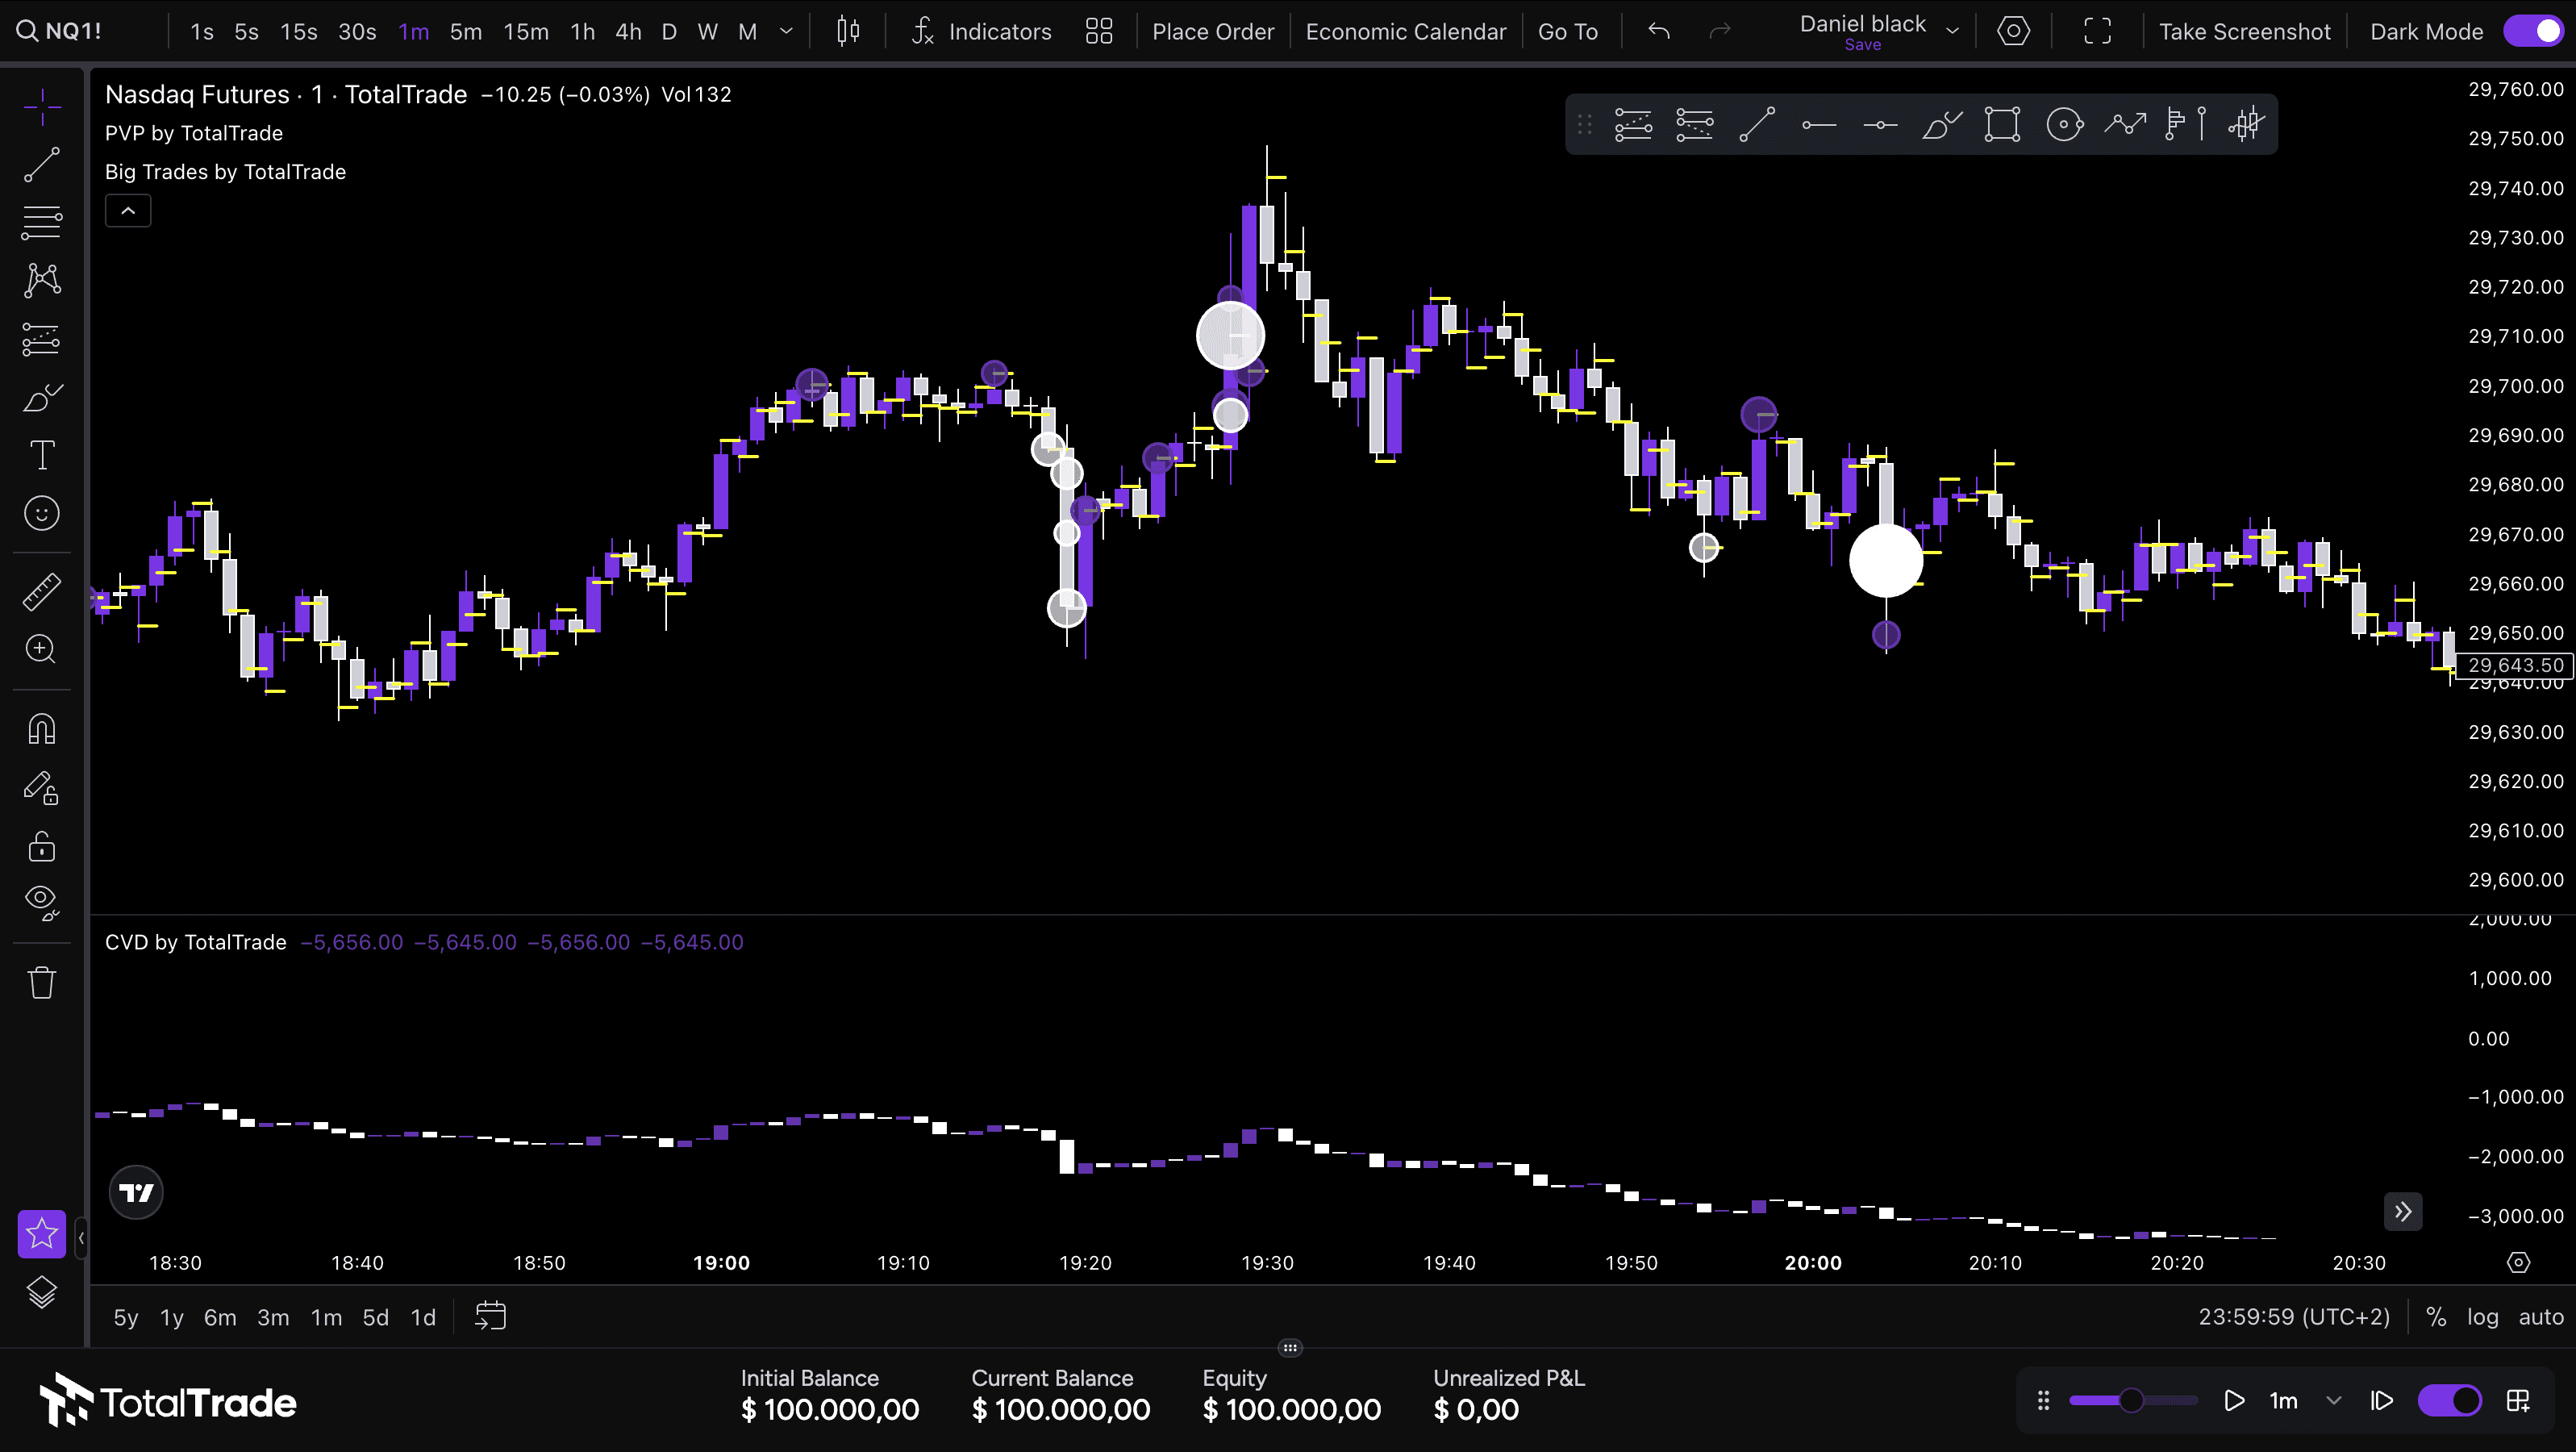
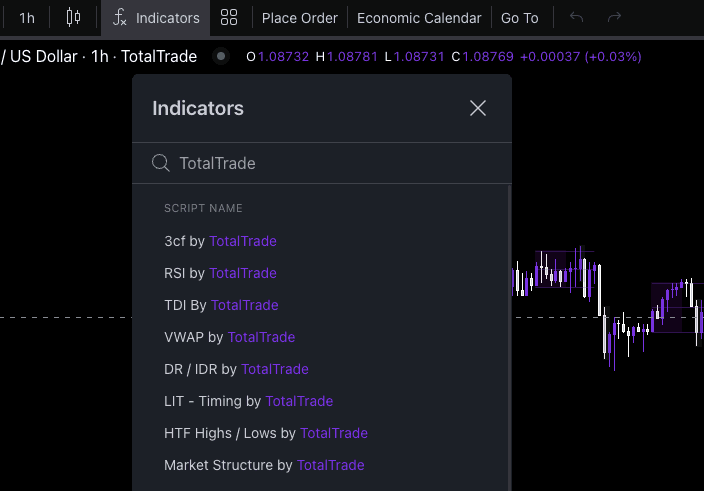
The Backtester chart is built on TradingView, so you can draw trendlines, zones, text and measurements and use the supported TradingView indicators. You can also search for TotalTrade indicators directly from the Indicators panel. Tools such as Session Indicator add useful context while keeping the chart clear.
TotalTrade brings together the tools you use every day to make trading clearer and measurable.
Start for free